Connect Kubernetes telemetry to a registered cluster so Hyphen Agent can use runtime metrics and logs alongside inventory. Kubernetes observability supports New Relic, Datadog, SigNoz, and Google Cloud.
Observability is optional for inventory and cleanup. It gives Kubernetes Optimizer more evidence about workload utilization, restarts, and runtime behavior.
Table of Contents
- Before You Start
- Connect an Observability Source
- Connection States and Errors
- Remove a Connection
- Things to Know
Before You Start
You need:
- A registered Kubernetes cluster with Horizon connected.
- A New Relic, Datadog, SigNoz, or Google Cloud organization integration in Hyphen.
- Permission to manage organization integrations and cluster settings.
- Kubernetes telemetry available in the selected provider.
Connect an Observability Source
- Open Kubernetes and select the cluster.
- Open Settings.
- In Observability, click Setup connection.
- Select one observability integration.
- Enter the provider-specific cluster identifier.
- Click Connect.
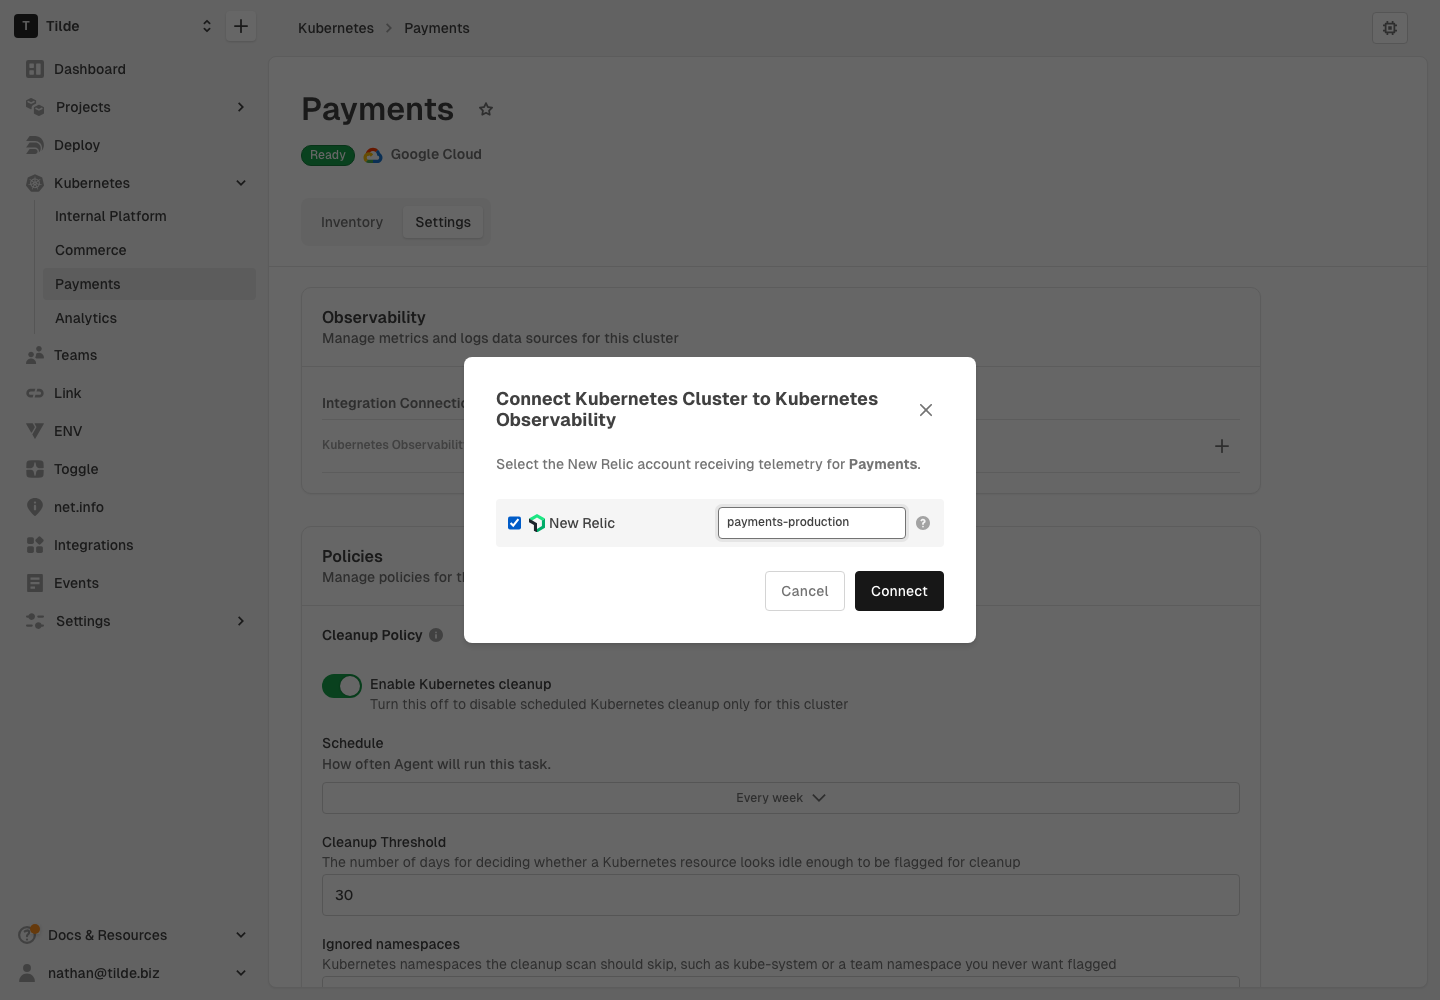
Hyphen validates the identifier and shows the connection while it is being prepared. A ready connection can supply metrics and logs to supported Agent runs.
New Relic
Enter the cluster name configured when the New Relic Kubernetes integration was installed. Hyphen verifies that the connected New Relic account contains a Kubernetes cluster sample with that name.
If Horizon detects one New Relic cluster name and the organization has exactly one New Relic integration, Hyphen can create the connection automatically. A newly installed New Relic agent may take time to send its first cluster sample; Hyphen retries retryable connection failures while telemetry becomes available.
See New Relic for integration requirements.
Datadog
Enter the exact lowercase kube_cluster_name tag value emitted by Datadog for the cluster. Hyphen requires Kubernetes State Core node-count samples with that tag from the last 24 hours to validate the connection.
When observability discovery is enabled, Hyphen can create the connection automatically if Horizon detects one Datadog cluster name and the organization has exactly one Datadog integration. Otherwise, connect it from the cluster's Settings tab.
See Datadog for access-token permissions, telemetry tags, and metric requirements.
SigNoz
Enter the exact k8s.cluster.name resource attribute emitted by your OpenTelemetry collectors. Connect SigNoz from the cluster's Settings tab.
Hyphen checks that the SigNoz query API accepts a log query scoped to that name. The connection can become ready with no matching logs, so verify that metrics and logs carry the cluster, namespace, and pod attributes used by the connection.
See SigNoz for API-key, endpoint, and collector requirements.
Google Cloud
Enter the full GKE cluster resource name:
projects/PROJECT_ID/locations/LOCATION/clusters/CLUSTER_NAME
The Hyphen service account needs these roles for the selected cluster and its telemetry:
- Logs Viewer (
roles/logging.viewer) - Monitoring Viewer (
roles/monitoring.viewer) - Kubernetes Engine Cluster Viewer (
roles/container.clusterViewer)
Hyphen can discover the resource name automatically when Horizon detects Google Cloud observability, the organization has exactly one Google Cloud integration, and Cloud Asset Inventory can resolve the cluster.
See Google Cloud for integration requirements.
Connection States and Errors
- Pending - Hyphen is validating the provider and cluster identifier.
- Ready - Metrics and logs are available to supported Agent analysis.
- Error - Hyphen could not validate the cluster or query the provider. Open the connection to review the error and retry when available.
A missing New Relic cluster sample may be temporary while telemetry is first ingested. A Google Cloud not-found error can mean the resource name is incorrect or the Hyphen service account is missing the required viewer roles.
A Datadog not-found error means no matching Kubernetes State Core node-count samples were found in the last 24 hours. Check the cluster tag and telemetry, then retry. A ready SigNoz connection with empty results can mean telemetry has not arrived or its resource attributes do not match.
Remove a Connection
Open the cluster's Settings tab, find the provider under Observability, and remove its connection. Removing the connection does not uninstall an observability agent or delete provider telemetry. Agent continues to use Kubernetes inventory, but no longer queries that provider for the cluster.
Things to Know
- Metrics and logs are supporting evidence; missing or partial telemetry does not prevent inventory from working.
- Hyphen limits telemetry queries by time, workload, and pod context. Provider query errors are reported as capability gaps instead of being treated as healthy evidence.
- Connect the provider account that receives telemetry for the registered cluster.
- Hyphen does not request Kubernetes Secret contents for optimizer analysis.