
Inventory snapshots show the Kubernetes resources Hyphen can see in a registered cluster. Use snapshots to inspect cluster nodes, namespaces, workloads, pods, services, ingresses, config maps, warnings, and how the cluster changes over time.
Table of Contents
- Start the First Snapshot
- View Inventory
- Review Cluster Health
- Inspect a Resource
- Compare Snapshots
- Things to Know
Start the First Snapshot
Open Kubernetes, select a cluster, and stay on the Inventory tab. If the cluster has not reported inventory yet, click Start Inventory Snapshot.
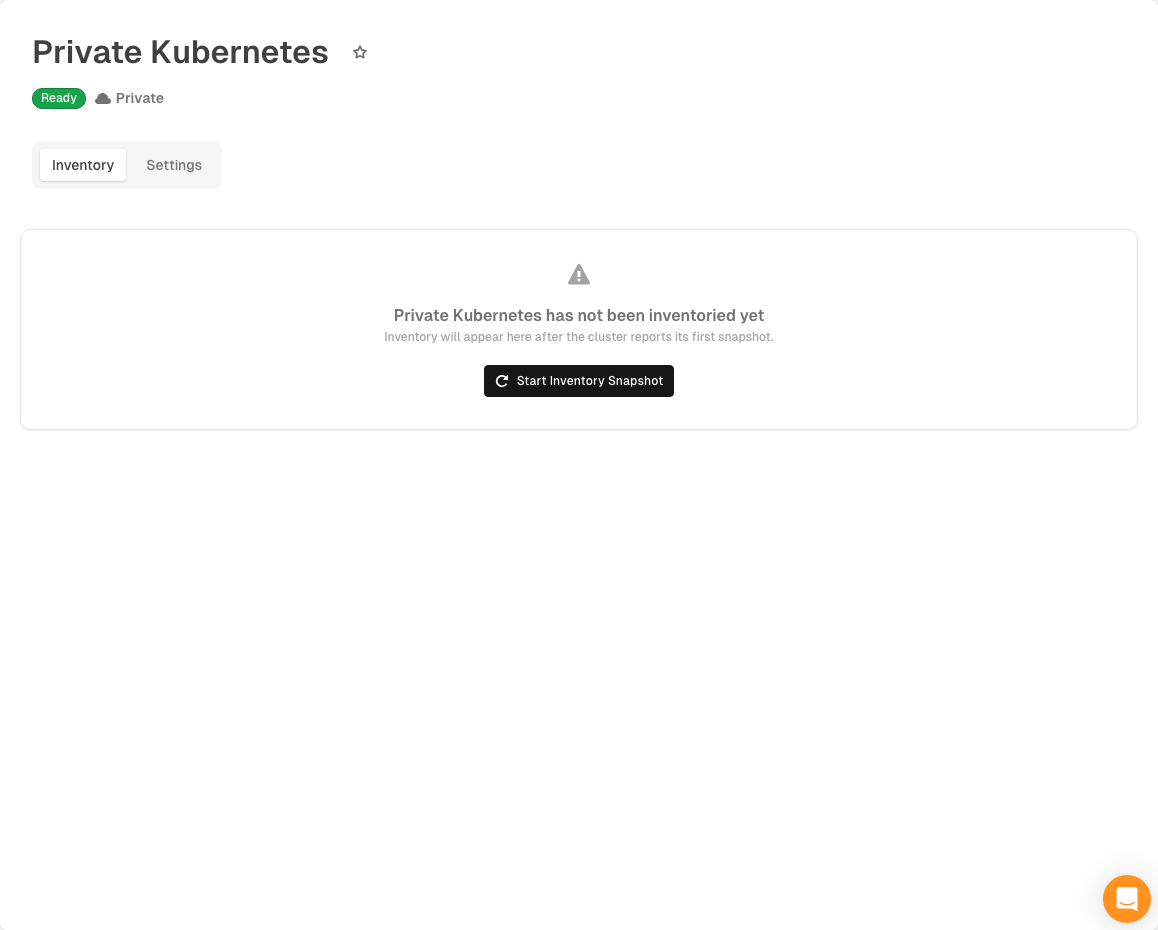
Hyphen starts a snapshot workflow and shows progress while the cluster refreshes inventory. When the workflow completes, the inventory graph appears.
View Inventory
The inventory graph places cluster nodes in a top band, groups namespaced resources, and connects related workloads, ReplicaSets, pods, services, ingresses, and config maps.
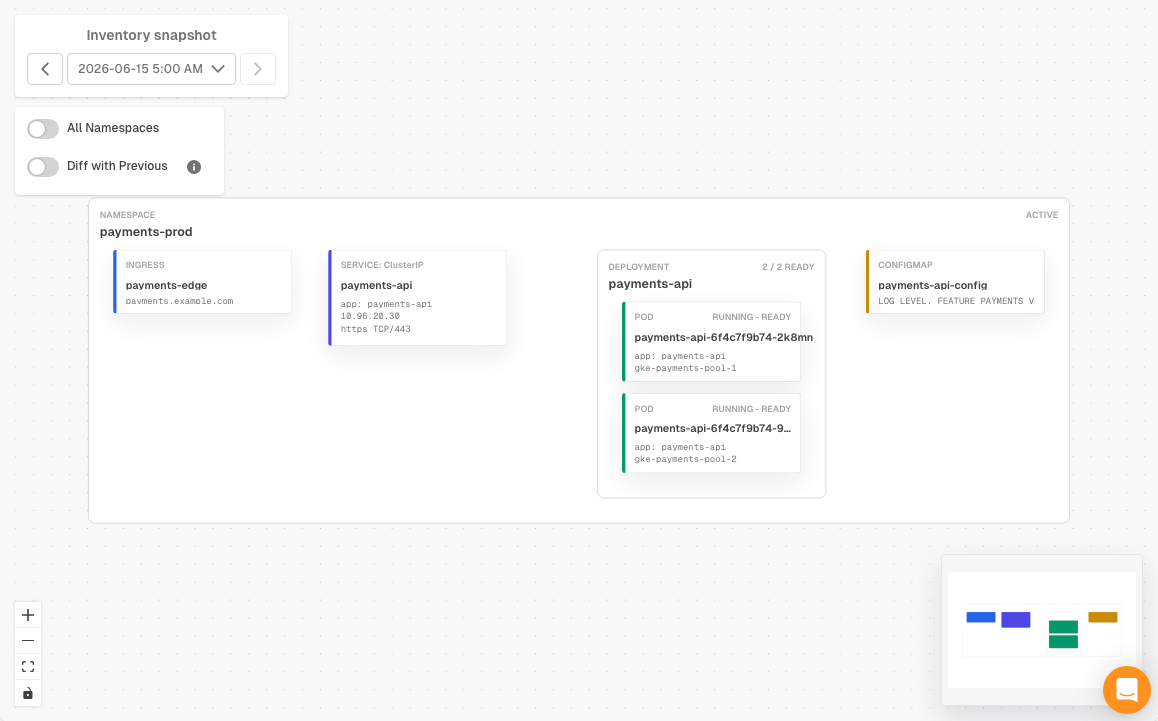
Use the graph controls to:
- Choose the selected inventory snapshot.
- Move to the previous or next loaded snapshot.
- Load more historical snapshots when available.
- Click Refresh Inventory to create a new snapshot.
- Toggle All Namespaces to include namespaces hidden by the default view.
- Filter resources by labels.
- Click a resource node to inspect its details.
Review Cluster Health
The Kubernetes list and organization dashboard summarize the latest inventory across registered clusters. Fleet metrics include connected and healthy clusters, ready and total pods, container issues, and warnings.
Within a cluster, summary rails help focus the graph:
- Nodes centers the cluster node band.
- Workloads groups workloads by app and namespace.
- Pods summarizes ready and not-ready pods and calls attention to pods that need investigation.
- Exposure and Events summarize reachable resources and recorded warning events. A pod keeps its warning event history even after it recovers, so past issues stay visible alongside current ones.
Cluster health uses the latest cluster state and inventory. Issues take priority over warnings. A cluster with warnings or not-ready pods needs attention, while a cluster without a snapshot remains unknown and shows Inventory pending.
Inspect a Resource
Select a node in the graph to open its resource details. Depending on the resource, the panel can show:
- Ownership hierarchy, including Deployment, ReplicaSet, and Pod relationships.
- Status, readiness, creation time, labels, metadata, and related resources.
- Recorded warning event history and container startup issues, including events from before a pod recovered.
- A collapsible raw manifest view.
The selected resource is stored in the page URL. You can copy the link to share the same resource view, and use browser back and forward navigation to move through previously selected resources. Agent references can also link directly to supported Kubernetes objects.
Use Zoom to node in the details panel to re-center the graph on the selected resource without losing your selection.
Compare Snapshots
Turn on Diff with Previous to compare the selected inventory snapshot with the immediately older snapshot. Added resources and removed resources are highlighted in the graph.
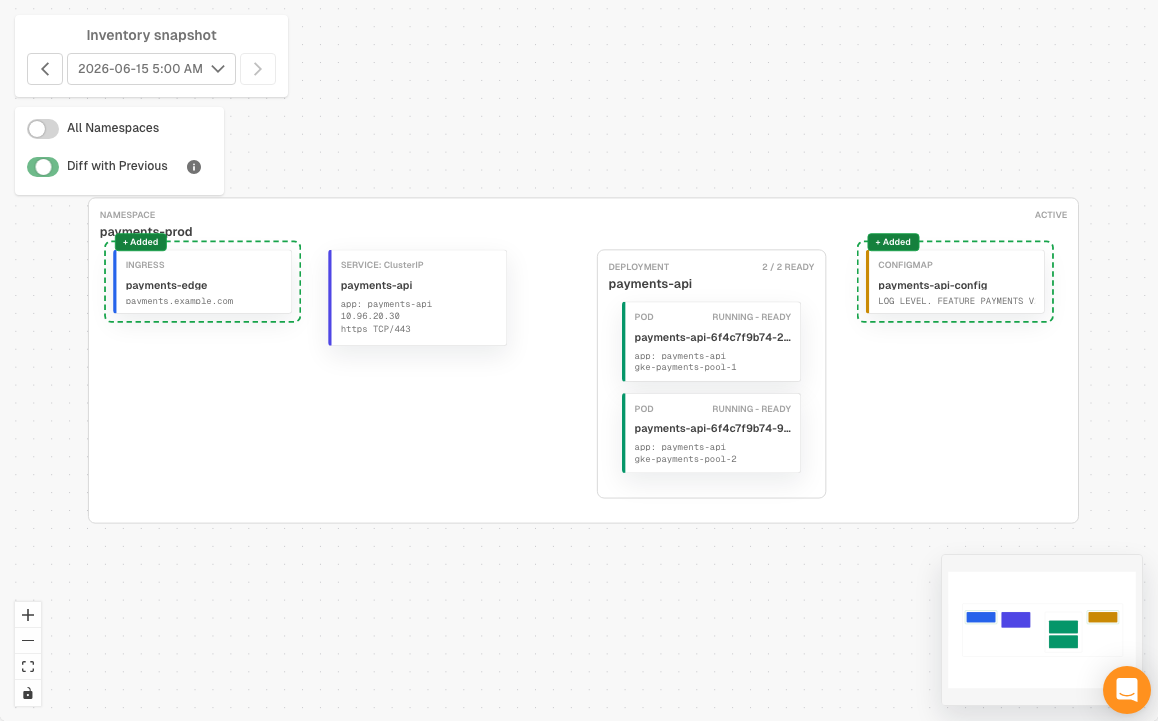
If there is no earlier snapshot, or if the previous snapshot is still loading, Hyphen explains why the diff is not available.
Things to Know
- Inventory snapshots are read-only.
- Refreshing inventory starts a new workflow for the selected cluster.
- The latest snapshot is selected by default unless you open a link to a specific snapshot.
- Historical snapshot navigation depends on the snapshots already loaded in the selector.
- Inventory may omit resources when collection limits are reached. Agent reports truncated inventory as a capability gap when it affects analysis.