
Faster Kubernetes Troubleshooting with Observability
added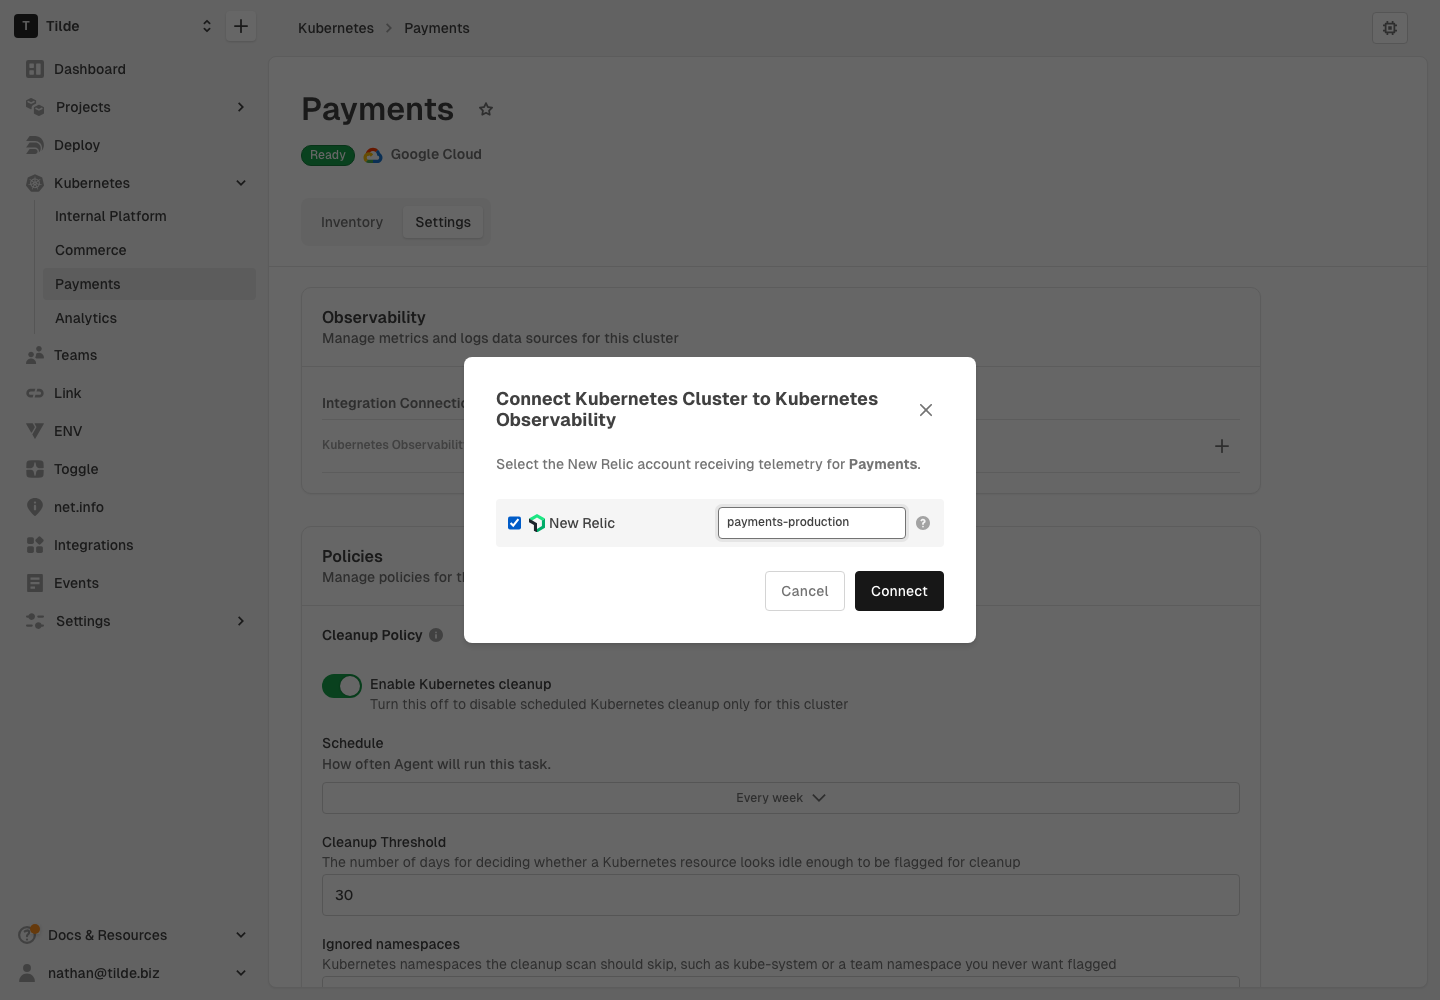
This week's update makes it easier to troubleshoot Kubernetes workloads in Hyphen. Teams can connect runtime observability data like New Relic, jump directly to the resource they are investigating, see clearer warning context, and review more complete deployment run history after a deploy.
Connect Cluster Telemetry to Agent Analysis
Kubernetes clusters can now be connected to observability data more directly. For integrations such as New Relic, Hyphen now has a clearer setup path for bringing workload telemetry into cluster inventory and Agent analysis.
That gives Kubernetes Optimizer more runtime context when it reviews a workload:
- Metrics and logs can help Agent understand how a workload is behaving in production.
- Kubernetes-specific connection fields are easier to configure.
- Retryable integration errors are handled more gracefully during setup.
- Observability data is normalized before it is used in analysis.
When a pod or workload needs attention, Hyphen can connect what is deployed in the cluster with what is happening at runtime, which means less manual context gathering.
See the Cluster Issues and Warnings in Context
Kubernetes resource detail panels now show more of the ownership and issue context around a selected resource:
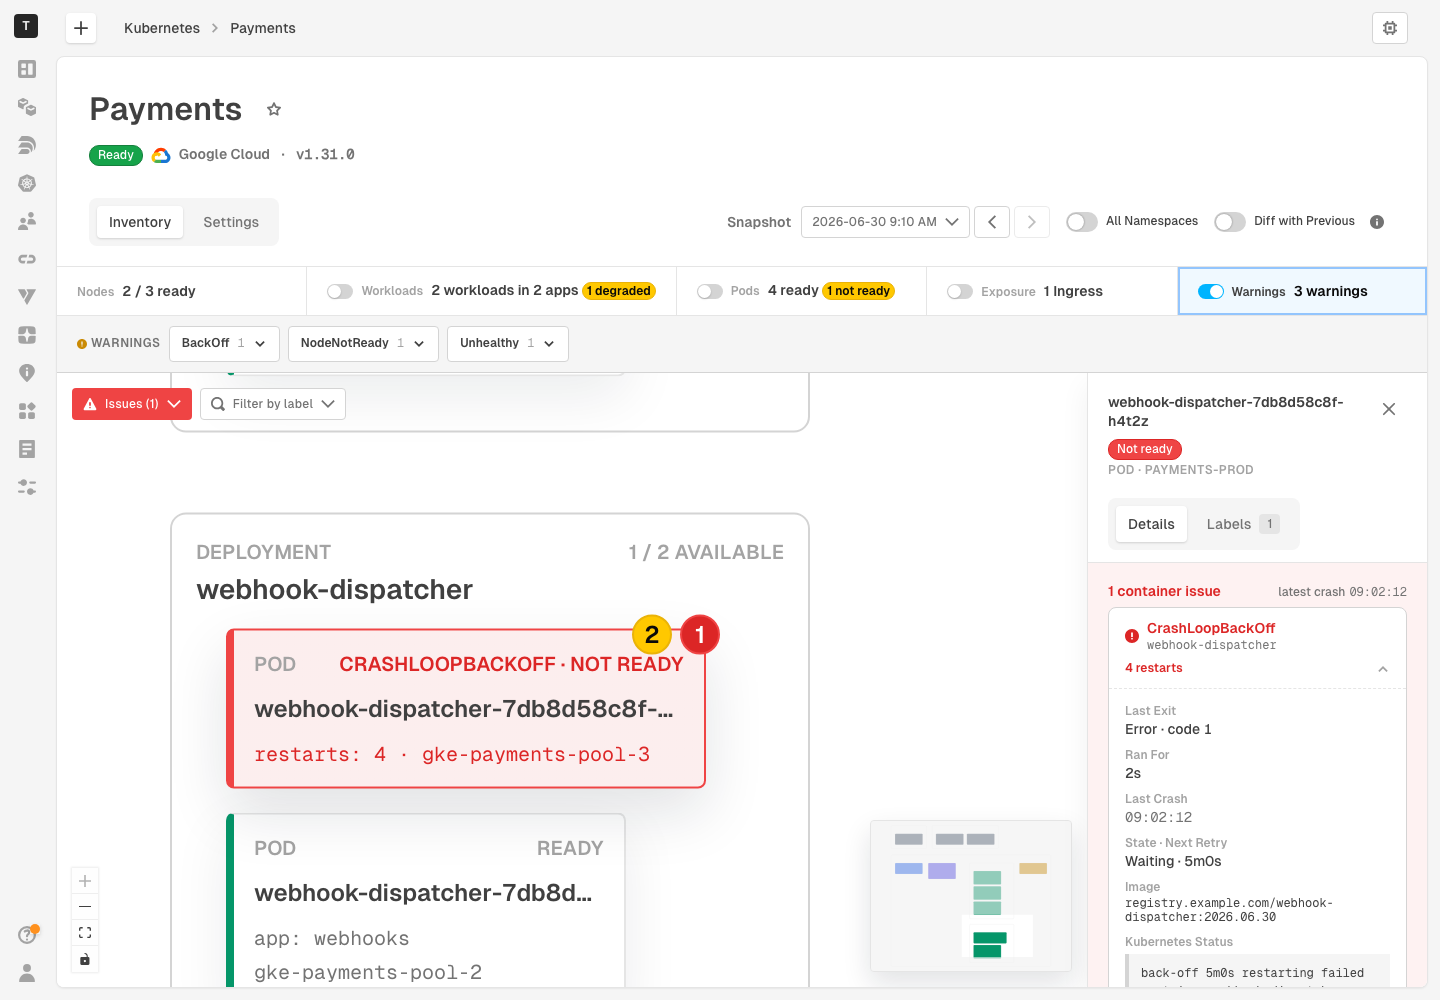
- Deployment, ReplicaSet, and Pod hierarchy is shown in the inventory diagram.
- Resource details include creation timestamps and a clearer hierarchy of metadata, labels, and related state.
- Label filtering helps narrow large cluster diagrams to the resources that matter for an investigation.
- Container startup issues are preserved in inventory and surfaced in the cluster experience.
- Warning and issue styling is more consistent across light and dark modes.
During debugging, teams can move from a warning or not-ready pod to the owning workload, labels, timestamps, and startup issue context without leaving the cluster view. That cuts down on tab switching and makes it clearer whether a problem is isolated to one pod or connected to a broader workload change.
Learn more in Kubernetes inventory snapshots.
Get Back to the Exact Resource
Inventory diagrams now make it easier to open, share, and return to the exact resource you are investigating:
- Kubernetes flow resources can be deep linked and navigated with browser history.
- Agent chat references can point to specific Kubernetes inventory objects.
- The Kubernetes cluster create flow is available from the global create menu.
- Kubernetes management is available without feature-flag setup.
This means teammates can share the same view during an incident, Agent can reference the resource it is discussing, and you can move backward and forward through an investigation without rebuilding the diagram state by hand.
More Complete Deployment Run History
Deployment run status updates and run-log writes are now handled more reliably when a deployment run is created, updated, or reported back to Hyphen.
For customers reviewing what happened after a deploy, this helps preserve run log data during execution and keeps deployment history more complete. The result is a clearer audit trail when a deployment succeeds, fails, or needs follow-up investigation.